Designed by npsBench
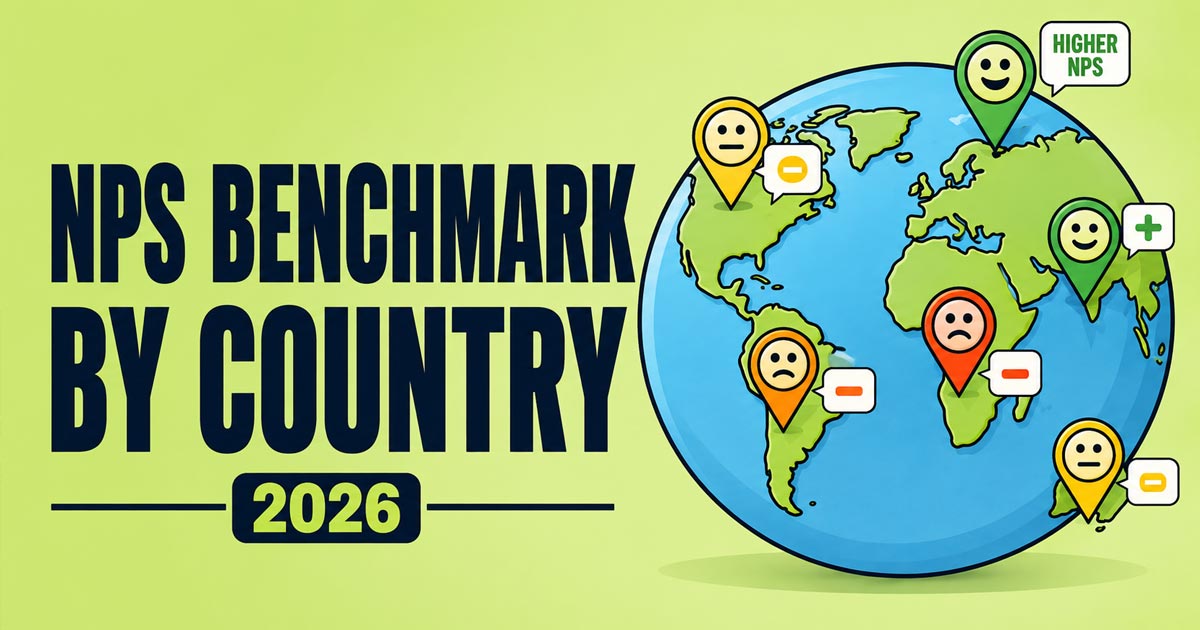
A good NPS in one country is not automatically a good NPS in another.
Customer expectations, competitive conditions and the mix of industries represented in each market can all change the reference point. That makes a country-level benchmark useful for international companies—but only when it is combined with industry and, where relevant, city context.
The latest npsBench dataset covers 12 countries, 174 cities and 20 industries, with benchmarks updated monthly.
This report looks at how Net Promoter Score benchmarks differ across markets and, more importantly, how to use those differences without turning a country average into another arbitrary target.
Why NPS Benchmarks Vary by Country
NPS is often treated as though the scale has the same meaning everywhere.
The mathematics does. The benchmark does not.
A score of 30 always represents the same calculation. What changes is whether 30 is high, low or ordinary relative to the market around it.
Several factors can contribute to those differences.
Customer expectations are not identical across markets. Competitive intensity varies. Some countries in the dataset have a larger representation of cities or certain types of businesses than others. Review behavior can differ as well.
Industry mix adds another complication.
A market with strong hospitality and luxury benchmarks may naturally look different from one where more of the customer experience is concentrated in utilities, telecommunications or other lower-benchmark sectors.
These are plausible explanations for geographic differences, not causes proven by the benchmark data itself.
The practical point is simpler: country context changes how an NPS should be read.
Current NPS Benchmarks by Country
npsBench currently tracks customer experience benchmarks across 12 countries:
Each country report can then be broken down by city and industry.
That hierarchy matters. The country score answers one question: what does the broader market currently look like?
It does not necessarily answer the more operational question: what should a company like ours, in this market, be achieving?
For that, the benchmark needs to get narrower.
Countries with the Highest NPS Benchmarks
The current data already shows meaningful differences between markets.
Among the July 2026 country pages verified for this report, Qatar records a benchmark of 37.8, compared with 33.0 in Italy, 31.5 in Spain, 30.3 in the Netherlands, 30.1 in Belgium and 29.1 in Canada.
The gap between Qatar and Canada is 8.7 NPS points.
That is substantial enough to affect how the same company score would be interpreted.
An NPS of 32, for example, sits above Canada's current national benchmark. The same score would be below Qatar's current benchmark.
But there is an important qualification.
Qatar currently represents one benchmarked city—Doha—and has only two months of available history. Canada covers 13 cities and has 31 months of history.
Those are not equivalent panels.
A higher country benchmark is therefore not evidence that one country is inherently “better” at customer experience. It is a description of the markets currently represented in the dataset.
That distinction is particularly important when comparing newer markets.
Countries with the Lowest Current Benchmarks
The same caution applies at the other end of the distribution.
Canada's current benchmark of 29.1 is lower than the July benchmarks currently published for Belgium, the Netherlands, Spain, Italy and Qatar.
It would be a mistake to conclude from that alone that Canadian businesses provide weaker customer experiences.
Canada has a much deeper historical series and a different geographic and industry mix. Its 13 cities also vary internally: Toronto currently stands at 32.3, while the lowest represented city is 6.6 points behind the country's leading city.
The national figure compresses all of that into one number.
This is why npsBench uses the language lower current benchmark, rather than ranking countries as best or worst.
A benchmark describes a reference point. It does not grade an entire country.
How Geography Changes the Meaning of a Good NPS
Consider a company with an NPS of 31.
Against Canada's July benchmark of 29.1, that score is above the national reference.
Against Italy's 33.0, it is below.
Against Qatar's 37.8, it is considerably lower.
Nothing about the company's score changed.
Only the comparison did.
And country is still not the end of the analysis.
Take Canada. The national benchmark is 29.1, but Toronto currently stands at 32.3 and Montreal at 31.5.
A business scoring 31 would therefore sit above the national benchmark while still trailing Toronto's local market.
The same effect appears in Europe. Italy's national benchmark is 33.0, while Verona reaches 35.2 and Venice 35.1. Spain stands at 31.5 nationally, while Barcelona reaches 35.8.
For a local operator, that city gap may be more relevant than the difference between two countries.
This is especially true for hotels, restaurants, dealerships, retailers and other businesses where customers experience the brand locally.
Country vs Industry Benchmarks: Which Should You Use?
Use both.
Country and industry benchmarks answer different questions.
The country benchmark tells you about the market.
The industry benchmark tells you about the category.
A company operating internationally needs both dimensions because industry differences can be considerably larger than country differences.
Canada is a useful example.
Its overall July 2026 benchmark is 29.1. But Hotels and Resorts reaches 43.2, while Energy and Utilities stands at 15.7.
That is a 27.5-point industry gap inside the same country.
So imagine a Canadian hotel with an NPS of 35.
Against the country benchmark, 35 looks strong.
Against the Canadian Hotels and Resorts benchmark, it does not.
The reverse can happen in a lower-scoring category. A Canadian utility with an NPS in the low 20s would sit below the national benchmark but comfortably above the current utility benchmark.
This is why neither “our NPS is above the country average” nor “our NPS is below the global average” is enough to evaluate performance.
The relevant question is:
Above or below which benchmark?
The Same Industry Can Look Very Different Across Countries
Geography becomes even more useful when the industry is held constant.
Instead of comparing the overall NPS of Canada with Italy, compare the same category in both markets.
Hotels and Resorts, for example, reaches 43.2 in Canada and 49.0 in Italy in the current July reports.
Consumer Electronics stands at 25.2 in Canada and 29.8 in Italy.
The national difference between Canada and Italy is 3.9 points. The gap between their hotel benchmarks is larger.
That tells an international hotel operator something the global Hotels and Resorts benchmark cannot: expectations and competitive reference points can move materially from one market to another.
The pattern is not necessarily identical in every sector.
That is precisely why the useful unit of comparison is often not:
Company vs. global NPS
but:
Company vs. industry × country × period
For businesses with strong local exposure, one more dimension can be added:
Company vs. industry × country × city × period
The comparison gets narrower, but it also becomes more actionable.
International NPS Benchmarks Need Comparable History
There is another issue that is easy to miss when comparing countries: not every market has been tracked for the same length of time.
npsBench currently has three main historical cohorts.
Canada and the United States have data from January 2024.
France, Spain, Italy and Germany have data from September 2025.
Mexico, Portugal, the Netherlands, Belgium, the United Arab Emirates and Qatar were added in June 2026.
This matters.
Canada currently has 31 months of history. Italy and Spain have 11. Belgium, the Netherlands, Portugal and Qatar currently have two.
A two-month series can tell you where a benchmark sits now. It cannot tell you much about seasonality or long-term direction.
So when comparing international NPS benchmarks, distinguish between two questions:
Where is the market now?
and
How has the market behaved over time?
The first can be answered relatively quickly. The second needs history.
How to Compare Your NPS Across International Markets
For organizations operating in several countries, a single global target is convenient. It is not always informative.
A better comparison follows a sequence.
1. Start with the same period
Use benchmarks from the same month or quarter wherever possible.
Comparing your July 2026 NPS with a market benchmark from 2024 introduces a time difference before the geographic comparison even begins.
2. Compare the country
Establish the broad market reference.
If your French operation is at 32, compare it with France—not immediately with the United States or a global average.
3. Add the industry
This is usually the most important correction.
A national benchmark combines businesses with very different customer relationships. Hotels should be compared with hotels. SaaS companies with SaaS companies. Utilities with utilities.
4. Add city context where the business is local
National averages can hide substantial local variation.
In Spain, Barcelona currently sits several points above the national benchmark. In Canada, Toronto does the same.
For a location-based company, that local competitive environment matters.
5. Compare direction
A point-in-time benchmark tells you where you stand.
The trend tells you whether the gap is closing.
A company can remain above its country benchmark while gradually losing ground to its industry. Conversely, an organization below the benchmark may be improving faster than the market around it.
Both signals matter.
6. Keep internal and external NPS separate
npsBench provides an external market benchmark derived from standardized public customer review data.
Your internal NPS survey measures responses from your own customers.
They are not interchangeable.
Use the internal survey to understand your customer relationships. Use external benchmarks to understand the market around them.
Why a Global NPS Benchmark Is Usually Not Enough
A global NPS benchmark has a role. It provides orientation.
Its weakness is that it removes context.
The more markets, sectors and cities that are combined into one number, the less closely that number resembles the environment in which an individual company actually competes.
That does not make global benchmarking useless. It makes it a starting point.
A sensible hierarchy is:
Global → Country → Industry → City
The right stopping point depends on the business.
A global software platform may care more about country and industry than city.
A hotel group should probably go further.
A local restaurant has little reason to optimize against a global cross-industry NPS number when a benchmark for restaurants in its own market is available.
Specificity makes the comparison more useful—as long as there is enough data behind it.
Methodology and Data Coverage
npsBench aggregates publicly available customer ratings and reviews from supported sources including Google, Tripadvisor and Yelp.
Records are organized by business, location and industry and standardized to reduce duplicate listings, inconsistent categories and differences between platforms.
A proprietary normalization methodology converts heterogeneous review and rating signals into a standardized external benchmark. Results are organized into monthly periods and published when sufficient market coverage is available.
The current NPS Index covers:
- 12 countries
- 174 cities
- 20 industries
- Monthly updates
Historical coverage varies by country, which is why long-term comparisons are not available for every market yet.
These benchmarks are designed to provide external market context. They should be used alongside an organization's own NPS survey and Voice of the Customer program, not as a replacement for them.
NPS Benchmark by Country FAQ
What is a good NPS by country?
There is no single good NPS for an entire country.
A country benchmark provides a useful national reference, but industry and local market conditions can shift the relevant target substantially.
Start with the country benchmark, then compare your score with your industry in that country.
Should I use a global NPS average?
Use a global NPS benchmark for broad context, not as your only performance target.
A country and industry benchmark is usually more relevant because it compares your score with organizations operating under more similar market conditions.
Why can the same industry have different NPS benchmarks in different countries?
Customer expectations, competition, market composition and review behavior can differ across countries.
The current npsBench data shows that the same sector can have materially different benchmarks from one market to another. These differences describe the observed market; they do not by themselves prove what caused the gap.
Which country has the highest NPS benchmark?
Among the July 2026 country pages verified for this report, Qatar has one of the highest current benchmarks at 37.8.
That figure requires context: Qatar currently has one represented city and only two months of history. It should not be interpreted as evidence that Qatar universally delivers better customer experience than countries with larger and longer-running panels.
How often do country NPS benchmarks change?
npsBench updates its benchmarks monthly.
Small monthly movements should not automatically be treated as meaningful trends. Markets with longer historical series provide a stronger basis for evaluating direction and volatility.
Should multinational companies use the same NPS target in every country?
Not necessarily.
One global target can be useful for internal consistency, but market-level targets show whether each operation is competitive in its own environment.
A multinational organization can track both: a global internal objective and a local benchmark gap for each country.
The Useful Benchmark Is the Closest Relevant One
There is no contradiction between global, country and industry benchmarks.
They are different layers of the same comparison.
The global number provides orientation. The country establishes market context. The industry adjusts for customer expectations. The city can make the benchmark operational.
The mistake is stopping too early.
If your business operates in several markets, start with the country. Then narrow the comparison until it resembles the environment your customers actually experience.