Designed by npsBench
If you’ve flown in Canada lately, you already know the experience can swing from “smooth and oddly pleasant” to “why am I still at the gate.” That volatility is exactly why Net Promoter Score (NPS) is such a useful lens. It does not just measure satisfaction. It captures loyalty, tolerance, and how quickly goodwill evaporates when operations go sideways.
Between November and December 2025, npsBench measured customer loyalty for airlines operating in Canada and compared results nationally and city by city. One thing stood out immediately: in Canada, an airline’s national NPS can look “okay” while specific cities swing wildly, sometimes by more than 100 points.
That gap is where the real story is.
The Canada-wide leaderboard: Top 5 vs Bottom 5
Top 5 (Canada NPS)
- Korean Air: 23.5
- Japan Airlines: 20.0
- China Southern Airlines: 18.5
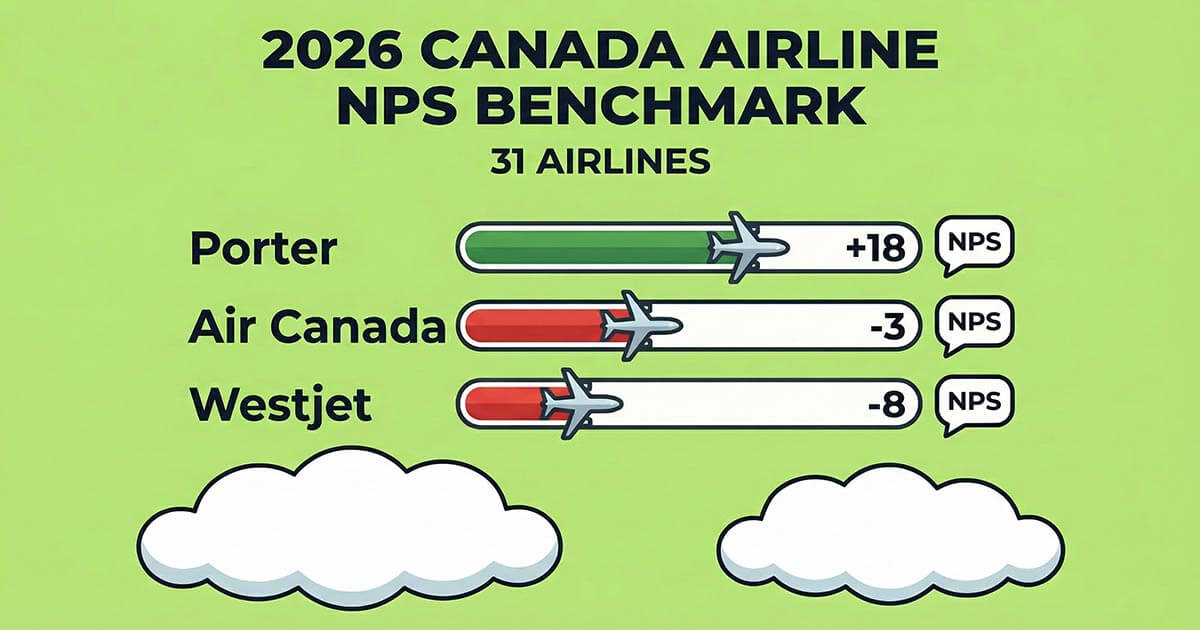
- Porter Airlines: 18.5
- China Airlines (Taiwan): 15.0
What jumps out: only one major Canadian carrier makes the top tier, and it’s Porter. The top of the table is dominated by international airlines, which often benefit from a few structural advantages: clearer product segmentation, more consistent long-haul service standards, and fewer domestic connection chains where things break.
Porter’s presence here is not accidental. Their product strategy is very “designed”: no middle seats on their E195-E2 jets, and an experience that feels more intentional than typical North American short-haul. That “no middle seat” positioning is repeatedly emphasized in coverage and reviews, and it tends to show up as goodwill in recommendation intent.
Bottom 5 (Canada NPS)
- EgyptAir: -70.0
- TAP Air Portugal: -75.0
- Sunwing Airlines: -75.8
- Lufthansa Airlines: -56.7
- Philippine Airlines: -52.5 (with Air Transat at -50.6 close behind)
What jumps out: Sunwing is not just low, it’s consistently low in multiple cities. And unlike some foreign carriers that may have limited Canadian touchpoints, Sunwing is a very “real” part of the Canadian leisure travel ecosystem, which means operational disruption gets remembered loudly.
The Canada big two: Air Canada vs WestJet (and why both land negative)
- Air Canada: -3.6 (11 cities)
- WestJet: -8.0 (12 cities)
Neither score is catastrophic, but both are negative. That usually means the “detractors” are not a small fringe. They’re a meaningful share of flyers.
When I try to explain why loyalty is fragile for Canadian carriers, I start with operational trust. Canada has had several high-salience disruption events that shape public perception quickly.
WestJet’s 2024 labour disruption (late June into early July) impacted a large number of customers and triggered mass cancellations right at a peak travel period. That is exactly the kind of moment that spikes detractor language and drags NPS down across cities.
Air Canada’s 2025 flight attendant strike and shutdown disrupted peak summer travel, grounded flights, and stranded large volumes of passengers. Even if you personally were not affected, events like this reset expectations and reduce forgiveness.
There’s also a broader structural issue: when complaints pile up, frustration lingers. Canada’s passenger protection framework exists, but consumers still report long timelines and a heavy complaints load. The Canadian Transportation Agency publishes statistics on complaints and backlog dynamics, which is the kind of macro pressure that contributes to negative sentiment over time.
The geography story: West vs East is not subtle
One of the most useful parts of your dataset is city-level NPS. Even with small samples, patterns show up fast.
West Coast and Prairies: more volatility, sharper penalties
Take Vancouver. For several airlines, Vancouver is a tough room:
- WestJet in Vancouver: -53
- Delta in Vancouver: -65
- Asiana in Vancouver: -70
- United in Vancouver: -60
And yet Korean Air is +25 in Vancouver and ranks #1 there, with Japan Airlines at +20. This is a classic split: strong long-haul brands win in markets where the long-haul experience is a bigger part of the perception, while network carriers get punished when domestic connections, irregular ops, and rebooking complexity dominate the story.
Now look at Calgary:
- Air Canada: -3 (ranked #2)
- WestJet: -21
- Sunwing: -85
- Air Transat: -100
Calgary reads like a “network stress test.” If you are unreliable, Calgary’s NPS in this snapshot does not forgive you.
Atlantic Canada: extreme highs that smell like small-sample “hero moments”
St. John’s is wild:
- American Airlines: 80
- Air Canada: 78
- Emirates: 30
These numbers are so high that I treat them as “very likely small sample.” But they are still valuable. They tell you what happens when service is perceived as personal, punctual, or simply exceeds expectations in a smaller market. When that happens, people recommend loudly.
Halifax is another positive outlier:
- United Airlines: 55
- WestJet: 50
- Air Canada: 28
That’s a very different picture than Vancouver.
My take: the East in this dataset shows more “peaks,” while the West shows harsher “troughs.” If I were advising an airline, I would immediately ask: Is this a capacity and disruption management issue, or a customer expectation issue tied to specific airports and route types?
Porter’s profile: strong Canada score, but not universally loved
Porter’s Canada NPS is 18.5, which is excellent in this market, and they are top-ranked in places like:
- Regina: 40 (rank #1)
- Winnipeg: 40 (rank #1)
- Quebec City: 18
- Toronto: 13
But in Montreal, Porter is -5, and in Ottawa they are +5.
That is not a failure. It’s a signal.
Porter has been expanding fast with the E195-E2 fleet and route growth beyond its traditional core. Rapid expansion is exciting, but it also creates operational growing pains if staffing, ground handling, and disruption recovery do not scale perfectly. The fleet expansion milestone itself is well documented.
Actionable insight: Porter’s opportunity is to protect what makes the brand recommendable (the onboard feel and simplicity) while building a disruption playbook that matches the scale they’re reaching.
Add-on passage: Air Transat, Montreal, and the December labour shock
Air Transat is a special case in this analysis because Montreal is not just “a city” for Air Transat, it’s a core hub. In the Montreal snapshot, Air Transat sits at -38 NPS, and that weakness lines up with a very real December disruption: in early December 2025, Air Transat pilots issued a 72-hour strike notice, which triggered a gradual shutdown plan and led to flight cancellations before a last-minute tentative agreement was reached. Even though the walkout was ultimately avoided, the uncertainty hit right at the start of the holiday travel ramp-up, and Montreal-Trudeau was one of the focal points of the operational impact. Situations like this typically depress NPS fast because passengers remember the feeling of risk more than the final outcome, especially when rebooking and “will my flight operate” anxiety becomes the dominant experience.
Sunwing’s situation: consistently bottom-tier, and the “why” is easy to document
Sunwing is last in Canada at -75.8, and the city data reinforces it:
- Calgary: -85
- Charlottetown: -85
- Regina: -85
- Toronto: -65
- Ottawa: -70
For leisure carriers, NPS is heavily driven by two moments: “did we leave on time,” and “did we get home without chaos.” When weather, schedule recovery, or aircraft availability fails, leisure passengers feel trapped.
There were widely reported Sunwing cancellation and delay issues tied to winter storms and backlog recovery in Eastern Canada (plus knock-on impacts from major airport disruptions). That kind of story sticks and can absolutely depress NPS.
Also important for context: by May 29, 2025, Sunwing Vacations flights began being operated by WestJet. That operational integration can change passenger experience and complaint routing, and it’s a key industry shift to mention when discussing future NPS trends.
Toronto as a “reputation amplifier” (and how one event can ripple)
Toronto Pearson is a massive amplifier. When Pearson has an incident or capacity constraint, disruption ripples across the network.
In February 2025, a Delta-operated regional jet crash landing at Pearson led to runway closures and widespread operational impact at the airport, even after flights resumed. It was heavily covered and inevitably affected passenger experience during that period.
This matters because your Toronto city snapshot contains a lot of negative scores across multiple airlines. Some of that is normal “big hub stress.” Some of it is event-driven.
What airlines should do with this benchmark
Benchmarks only matter if they change behavior. Looking at this Canada-wide NPS snapshot, several clear actions emerge for airline leadership teams.
1. Stop treating NPS as a national average
A single Canada score hides too much. The gap between cities like Vancouver and Halifax, or Montreal and St. John’s, is often wider than the gap between two competing airlines. Operational planning, staffing buffers, and recovery playbooks should be adjusted at the city and airport level, not just at the brand level. If Vancouver consistently penalizes disruption harder than the East, that reality needs to be priced into schedules and contingency plans.
2. Treat labour risk as a loyalty risk
The data makes one thing clear: labour uncertainty translates almost instantly into NPS damage. The WestJet disruption, the Air Canada shutdown, and the Air Transat December strike notice all show the same pattern. Even when strikes are avoided, uncertainty alone erodes trust. Airlines should model labour negotiations as a customer-experience risk, not only a cost or legal issue, and proactively communicate stability plans when tensions rise.
3. Measure recovery quality, not just delay minutes
Passengers are surprisingly tolerant of bad weather or technical issues. What they do not forgive is silence, confusing rebooking flows, or inconsistent information across channels. Airlines with weaker NPS in this benchmark are not necessarily those with the most delays, but those perceived as slow or opaque during recovery. Tracking NPS specifically after irregular operations is one of the fastest ways to identify where loyalty is being lost.
4. Protect brand promises during expansion
Porter’s strong positioning shows that a clear, differentiated product still matters in Canada. But expansion amplifies risk. As networks grow, the experience during disruption becomes the true brand test. Airlines scaling quickly should actively monitor whether NPS dispersion is widening between legacy markets and newly added routes. When it does, that is an early warning signal.
5. Use competitors as context, not excuses
The value of a benchmark like this is not to justify poor performance because “everyone is struggling.” It is to identify who performs better under similar constraints. When one airline achieves positive NPS in a difficult airport while others collapse, that is not luck. It is process, staffing, or decision-making discipline.
For readers who want to go deeper, the full findings can be downloaded in two formats: