Designed by npsBench
This is our inaugural Canadian cut of restaurant NPS. It blends full service and quick service venues into a single baseline per province. Use it to set targets that reflect local realities, compare markets within your portfolio, and spot outliers before they grow. I will show the score and the size of the dataset behind it. Every market uses a robust sample that ranges from 200 to 450 restaurants, scaled to the importance of the region.
Quick takeaways
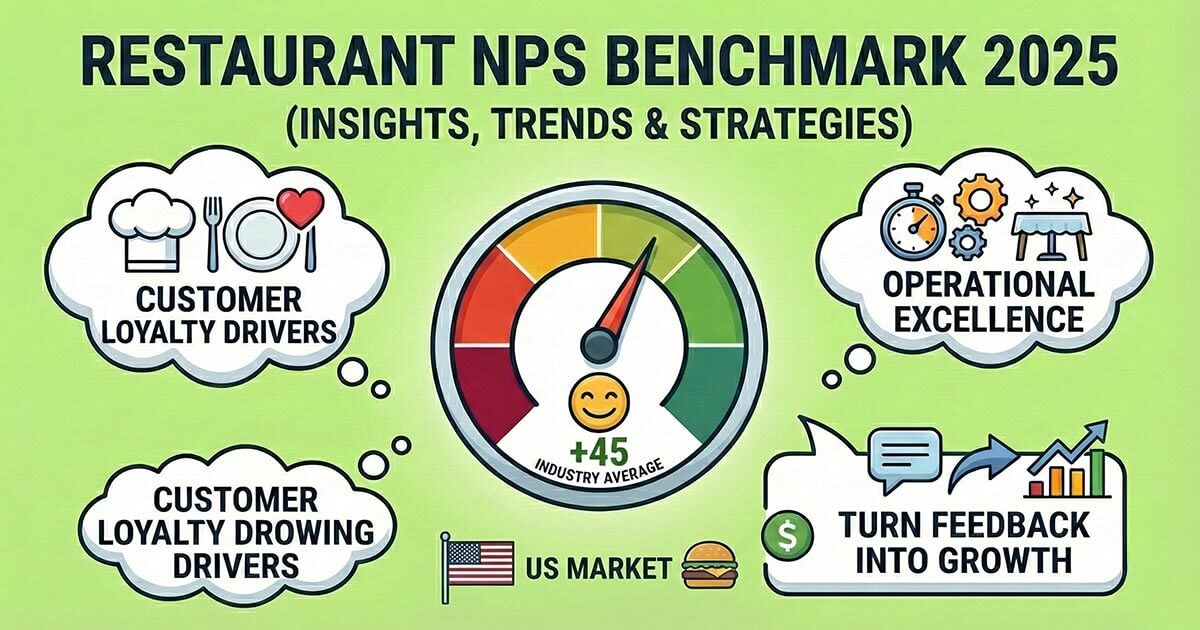
- Canada's blended picture sits in the low 40s.
- Culinary destinations with strong hospitality cultures lift scores in Québec and British Columbia.
- Local context matters. A 39 can be healthy in a tougher market if your peers cluster near that number.
Treat this as a reference baseline, not a replacement for your own relationship or transactional NPS.
See NPS benchmarks for 20 industries, region by region.


Restaurant NPS by Province (November 2024)
Values use the standard Net Promoter Score scale from −100 to +100. "Restaurants analyzed" reflects distinct venues across chains and independents that passed our inclusion checks.
| State | NPS (Dec 2024) | Restaurants analyzed |
| Alberta | 29 | 330 |
| British Columbia | 31 | 360 |
| Manitoba | 24 | 240 |
| New Brunswick | 29 | 220 |
| Newfoundland and Labrador | 31 | 210 |
| Nova Scotia | 30 | 230 |
| Ontario | 32 | 450 |
| Prince Edward Island | 35 | 200 |
| Québec | 32 | 440 |
| Saskatchewan | 27 | 220 |
How to read it?
A Halifax operator at 45 is outperforming Nova Scotia's baseline by 15 points. A Regina brand at 37 sits 10 points above Saskatchewan's baseline and should focus on whether this reflects a local competitive advantage (menu, speed, cleanliness) or a small-sample effect rather than chasing a generic national goal.
Methodology
Scope and window
Rolling 12 months ending 31 October 2024. This balances recency and seasonality.
Data sources and ingestion
- Multi source pipelines aggregate public review data at scale. Primary feeds include Google, TripAdvisor, and Yelp.
- Our entity resolution maps listings to venues, venues to brands, and brands to parent companies. Duplicates and retired listings are removed.
Aggregation and weighting
- Venue predictions roll up to brand NPS within each state. We weight by unique reviewer count so a large, busy venue does not get the same weight as a tiny listing.
- State baselines are a trimmed mean of brand NPS with a 5 percent trim on each tail to reduce outlier and fraud impact.
- A brand must clear a minimum effective sample threshold to be counted. States with higher population naturally have more qualified venues, which is why the "restaurants analyzed" count ranges from 200 to 450.
Quality controls
Language normalization supports English and major second languages present in U.S. markets. We also detect bots and abnormal reviews spikes.
FAQ
Does this include both full service and quick service?
Yes. This is a blended restaurant view. If you need a split, we can deliver FSR and QSR baselines per state as a separate cut.
What does "restaurants analyzed" represent?
Distinct venues included in the calculation after quality checks. Many belong to chains, many are independents.
Can I get a city level view or a competitor overlay?
Yes. The same pipeline powers city, county, DMA, and brand comparisons. We can generate a private pack for your footprint.
Final word
Benchmarks are context. Action comes from understanding why customers promote or detract in your market and then fixing the top friction points with discipline. If you want your own state by state and city by city pack with drivers and a clear action plan, that is exactly what npsBench was built to deliver.